82% Irish, Give or Take a Continent: The Shaky Math Inside Your Spit Tube
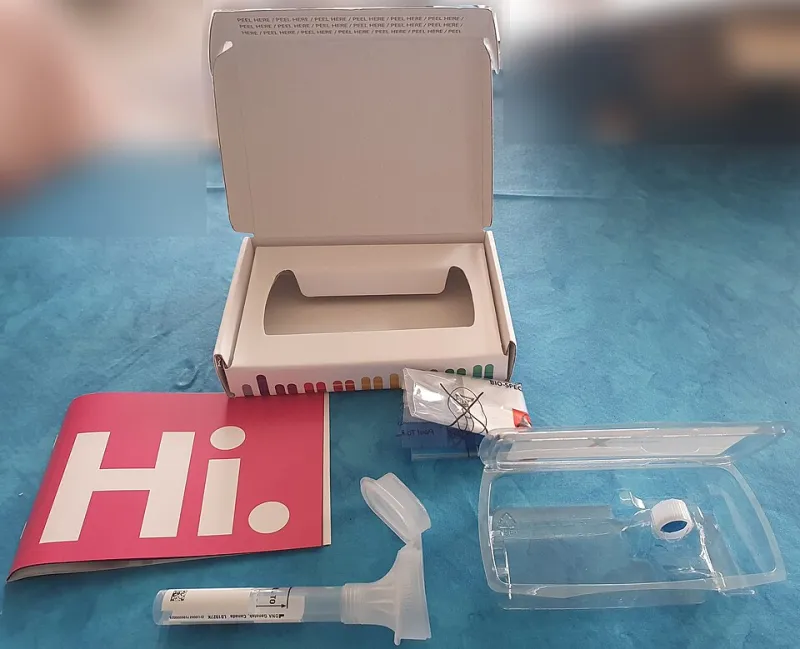
Photo: Veverve, CC BY-SA 4.0, via Wikimedia Commons
There's a particular thrill to opening an ancestry report. One minute you're an anonymous American with a mailing address; the next, you're 82% Irish, 11% Scandinavian, and 7% 'Eastern European, broadly.' It feels like a census of your soul.
It isn't. It's a statistical estimate built on comparisons so thin that the company itself, buried in fine print, basically admits it. Let's open the hood.
Your Genome Is a Huge Dataset. The Comparison Group Isn't.
The pitch works because '23andMe analyzes 650,000 data points' sounds enormous. And for you, it is — your genome is the biggest dataset you'll ever personally own.
But the ethnicity estimate doesn't come from your genome alone. It comes from comparing your markers to a reference panel: a few hundred to a few thousand people, per region, whom the company has decided represent 'Ireland' or 'Senegal' or 'the Baltics.'
Here's the uncomfortable question: who are those people, and how do we know they're representative? Many reference panels lean heavily on people whose grandparents all lived in one area — a group that was already rare in 1900 and is rarer now. An 'Irish' reference panel is a sample of self-selected volunteers, not a census of Ireland. When your reference n is small, your estimates wobble. That's not cynicism; that's sampling error doing what sampling error does.
The Confidence Interval Nobody Puts on the Box
Ask a statistician about an estimate and the first thing they'll ask for is the uncertainty. Ancestry companies do compute this — some even show it if you dig into the settings. Turn it on and '82% Irish' becomes something like '52–94% Irish.'
That range is the honest answer. Ethnicity is a continuum of genetic variation, and the borders companies draw on the map are marketing decisions, not biological ones. 'Broadly Northwestern European' isn't a dodge — it's the algorithm correctly telling you that a chunk of your DNA is common across a region and cannot be pinned to a village. The precise percentages on the front page exist because round numbers sell subscriptions.
Why Your Brother Is a Different Nationality Than You
The single best evidence that these estimates are noisy is the sibling paradox. Full siblings, same parents, same childhood — and routinely different ethnicity breakdowns. One gets 30% Italian; the other gets 12%.
This isn't a glitch. You each inherited a random half of each parent's DNA. Siblings share, on average, about 50% of their segregating DNA, which means the recombination shuffle deals each of you a different hand of ancestral markers. One sibling's hand happens to look more 'Italian' against the reference panel. Both results are 'correct' within their error bars — which should tell you how wide those error bars are.
What '82% Irish' Actually Means
Stripped of marketing, the number means something like this: of the segments of your DNA we could confidently assign to a population, 82% of them most closely resemble the DNA of people in our Irish reference panel, given the model we chose.
Every clause in that sentence carries weight. 'Most closely resemble' is relative, not absolute — your segment gets labeled Irish because it's more like the Irish panel than the French panel, not because it's authentically Celtic. 'The model we chose' matters because different companies use different algorithms, which is why the same saliva kit can make you Irish at one company and Scottish at another.
So Is It Worth Doing?
Honestly — yes, with the right expectations. The relative matches are genuinely powerful: finding a third cousin, confirming a family rumor, connecting with biological relatives. Those rely on comparing your DNA to other customers, and with millions of people in the databases, that's a real sample size. That's N equals many doing real work.
The ethnicity pie chart is the party trick. It's an estimate of an estimate, built on thin reference panels, smoothed by an algorithm, and displayed with false precision. Enjoy it the way you enjoy a fortune cookie: as a conversation starter, not a fact sheet.
Your ancestors were real. The percentages are a vibe with a confidence interval.