You Were the Guinea Pig Before Breakfast: Inside the Experiments You Never Signed Up For
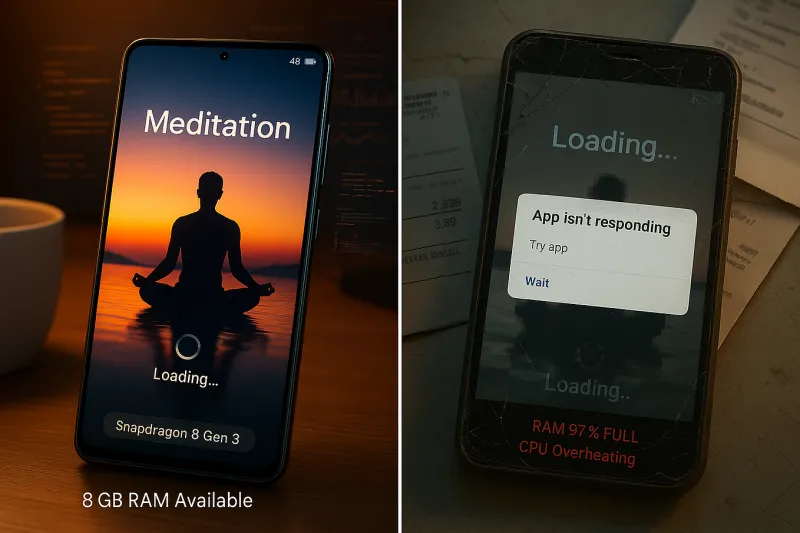
Photo: smartphone apps split screen comparison user interface testing, via miro.medium.com
Somewhere between your alarm and your first sip of coffee, you got assigned to a control group.
You didn't get a consent form. You didn't get a debrief. You got a slightly different shade of blue on a button, or a reordered list of restaurants, or a Netflix thumbnail where the lead actor is smiling instead of scowling. Congratulations — you're data now.
This is the quiet machinery of the A/B test, and it runs at a scale that would make the researchers behind the famous Framingham Heart Study weep with envy. Framingham followed about 5,000 people for decades. Your favorite app runs experiments on five million people before lunch.
The Biggest Lab in America Has No Walls
Here's the basic recipe. Take your user base — say, everyone who opens a food delivery app on a Tuesday. Randomly split them into two groups. Show Group A the app as it exists today. Show Group B a variant: new button color, new checkout flow, new default tip amount. Measure whatever matters to the business. Wait until the math says the difference isn't a fluke. Ship the winner to everyone.
That's it. That's the whole method. It's the randomized controlled trial, the same gold standard used to test cancer drugs, just pointed at your thumb instead of your bloodstream.
The scale is the story. One widely shared industry estimate suggests that major platforms run tens of thousands of concurrent experiments. Booking.com famously published a paper noting it had over a thousand live experiments running at any moment. If every experiment needs a treatment group and a control group, and your app experience is stitched together from dozens of features, then on any given day you're a subject in many studies at once — a whole portfolio of versions of you, none of which you'll ever see.
When N Equals Everyone
At N Equals Many, we spend a lot of time explaining why small samples lie. Tiny studies produce noisy results, fluky findings, and headlines that fall apart on replication. The A/B test solves that problem with brute force: when your sample size is in the millions, even absurdly small differences become statistically unambiguous.
And that's where things get philosophically weird.
A 2% lift sounds like nothing. Two percent! Who cares about two percent? But run the arithmetic. If a feature change nudges 2% more users through a checkout flow, and that flow sees 100 million sessions a month, the 'win' is two million additional completed decisions. Every month. The statistical significance isn't in doubt — with samples that large, nearly everything is significant. The real question flips: not 'is this effect real?' but 'is this effect worth anything?' And 'worth anything to whom?'
That second question is where the experiment stops looking like science and starts looking like policy. Nobody voted on it. There was no public comment period. The winner just quietly becomes the app, and your morning routine absorbs it before you notice anything happened.
The Consent Problem Nobody Puts in the Terms of Service
Defenders of the practice point out — correctly — that companies A/B test their own product. It's their button. Their checkout page. Their recommendation algorithm. If a restaurant rearranges its menu, you don't demand an ethics review.
But the analogy gets shakier the further the experiments reach. Platforms have tested pricing variations, default options that steer choices, notification timing tuned to maximize re-engagement, and interfaces designed around what makes people open the app again. At some point, 'we're improving our product' becomes 'we're optimizing your behavior,' and the subject of the experiment stops being the software and starts being you.
There's also the little-noticed fact that experiments can lose on purpose. A famous (possibly apocryphal, frequently repeated) story from early Microsoft testing claimed a UI change that made users unhappy kept them engaged longer — because they spent extra time figuring out what changed. Engagement metrics don't distinguish between delight and confusion. The algorithm doesn't know the difference between 'I love this' and 'I can't look away.'
What the Experiment Sees vs. What You Get
Here's a thought experiment worth sitting with. Suppose an experiment shows that users who receive a certain notification open the app 4% more often. Is that a success?
To the dashboard: unambiguously yes. To the user who was already regretting their screen time: possibly the opposite. The metric can't see regret. It can't see the difference between a notification that helped you catch a delivery and one that yanked you into a twenty-minute scroll. The experiment measures what it can count, and what it can count is a very specific, very partial slice of your Tuesday.
This isn't an argument that A/B testing is evil. Honestly, it's one of the more honest tools in tech — it can kill bad ideas before they ship, which is more than most industries can say. Used well, it's how companies discover that their cherished redesign actually confused everyone.
But it's worth knowing the shape of the machine you're inside. Randomized assignment. Massive samples. Significance guaranteed by scale. A winner declared by a metric that answers only to the business. And a rollout so smooth that millions of small decisions get nudged before anyone outside the building hears about it.
Reading Your Own Assignment
You can't opt out of being experimented on — that ship has not just sailed, it's docked and offloading cargo. But you can change how you interpret your own digital life.
When an app feels subtly different, it probably is. When a default option seems suspiciously convenient, ask who chose it for you. When you catch yourself doing something you didn't decide to do — opening the app, tapping the button, accepting the suggestion — there's a decent chance that moment was, at some point, a row in a spreadsheet with a favorable p-value.
The Framingham researchers changed heart medicine because they published their findings and let the world argue about them. Your apps run bigger studies and email the results to a dashboard. N equals many — in this case, all of us. The sample size was never the problem.
The question of who reads the results? That one's still in testing.