Your Heatwave Is Not a Trend: The Enormous Math Behind One Global Thermometer
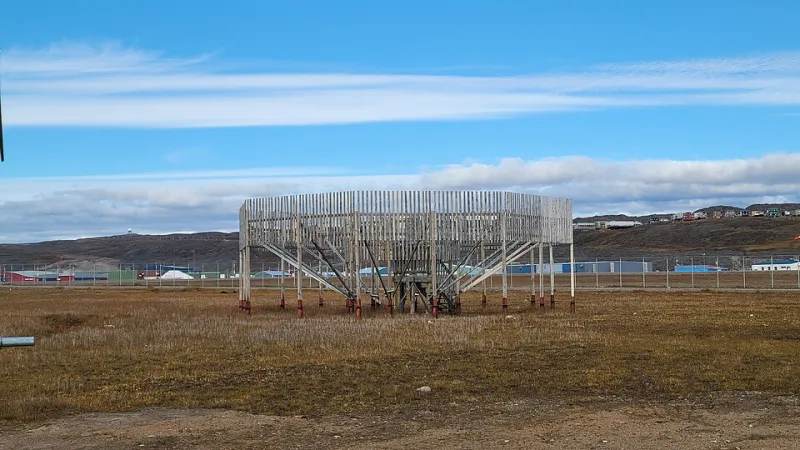
Photo: OhanaUnited, CC BY-SA 4.0, via Wikimedia Commons
It happens every year like clockwork. A heat dome parks itself over Phoenix, the mercury hits 118, and someone on your timeline declares the planet is obviously cooking. Then a polar vortex drops into Texas, the same person's uncle posts a photo of a snowed-in wind turbine, and suddenly climate change is a hoax. Both sides are making the same mistake, and it's a mistake this site exists to poke at: confusing a sample size of one weather event with a trend measured across the entire planet.
So let's do what we do around here — put a number on it.
One Storm Is a Data Point. Climate Is a Dataset.
Think of it this way. If your cousin buys one lottery ticket and wins, you wouldn't conclude that your cousin is a guaranteed millionaire. You'd want to know how many tickets everyone buys, how often anyone wins, and whether your cousin's win is better or worse than dumb luck would predict.
Weather works the same way. A single hurricane, heatwave, or cold snap is one lottery ticket. Some places get hot extremes in a warming world; some places, in some years, get unusually cold ones. That's not a contradiction — that's noise. And noise is the default state of the atmosphere.
The question that matters isn't "was it hot in Tulsa last July?" It's "across thousands of locations and decades of observations, are hot extremes becoming more common than the background randomness would expect?" When you ask the question that way, the answer is unambiguous: yes.
Assembling a Planet-Sized Thermometer
Here's the part that deserves more appreciation than it gets. Nobody owns a thermometer that measures the whole Earth. Instead, scientists stitch together a global instrument from thousands of pieces.
The NOAA Global Historical Climatology Network alone draws on well over 100,000 stations worldwide — airport weather offices, cooperative observers in small towns, ships, buoys bobbing in the Pacific. In the US, dedicated volunteers have been recording daily temperatures for the National Weather Service's Cooperative Observer Program since 1890, some from the same family farms for generations. (If you want a masterclass in the long, unglamorous work of data collection, look no further.)
Why does the pile have to be so big? Because individual stations are messy. A station gets moved. A parking lot gets built next to it and starts radiating heat. An instrument drifts. Any one of these things could fool you.
But here's the beautiful statistical trick: errors from messy individual stations tend to point in random directions, while the climate signal points in one direction — up. When you average thousands of stations, the random stuff mostly cancels out and the real trend survives. This is the same reason a poll of 1,000 voters beats your gut feeling about your neighborhood: n equals many, and many is where the truth lives.
When you aggregate that way, the last decade contains most of the warmest years in records stretching back to the 1800s. No single weather station says that. The ensemble does.
The 'Record' Records: A Sample-Size Illusion
Now for a fun wrinkle. When the news says "hottest day ever recorded in Death Valley," what does "ever recorded" actually mean?
It means: hottest day within the window of time we've been measuring, at the places we've been measuring, with the instruments we've had. The official US record books mostly start around the late 1800s. Before that? Nothing. Weather didn't start in 1895 — our receipts did.
That makes every "record" a statement about a sample, not about history itself. A town whose records begin in 1930 can only break a 1930-era record. And there's a subtle statistical wrinkle: as the record books get longer, breaking a record should get harder — the bar keeps rising. Which is exactly why the fact that heat records are still falling regularly, decades into dense record-keeping, tells you something. Under a stable climate, records get rarer over time. Under a warming one, they keep coming.
Same logic applies in reverse. When a snowstorm "breaks a 100-year record," that's a one-in-a-century draw from a distribution that still includes cold days. The distribution has shifted; it hasn't disappeared.
What a Good Sample Actually Shows
So what can you honestly say when your city breaks a heat record this summer? Roughly this: "This is the kind of extreme event that's becoming more likely in a warming climate." Not "this storm proves it," and definitely not "this cold snap disproves it."
Scientists have a phrase for the honest version: attribution. By comparing simulations of a world with human-caused warming against a counterfactual world without it, researchers can estimate how much more probable — or intense — a specific event became because of climate change. Heatwaves? The fingerprints are strong. For hurricanes, the clearest signal isn't more storms, it's wetter and more damaging ones, because warmer oceans and air carry more moisture.
The Takeaway
The next time a heat dome, a hurricane, or a surprise nor'easter shows up on your feed as evidence of anything, remember the lottery ticket. One draw tells you almost nothing. The pattern across thousands of stations, over more than a century, corrected for moved thermometers and paved parking lots — that's the dataset.
And that dataset has a verdict. It just doesn't fit in a single weather report.